New year, new energy to write up some content about the model at the heart of my Formula One ranking and prediction system. This is the model used in a few posts on FiveThirtyEight, including the 2021 season preview and (brief) season retrospective. It's also an evolution of the model used in the 2018 "Best Formula One Driver of All Time" article, which was the target of some (reasonable) criticism.
Over the next few posts I'll go into the conceptual parts of the model, describe how it's implemented, outline how the knobs are tuned, evaluate its predictive power, and walk through how the predictive ratings are aggregated into backwards-looking "resume" ratings like the ones used in the 2021 preview.
Overview
At its heart the objective of this system is to predict the answer to “will driver A in car X be in front of driver B in car Y at the end of the event?” It attempts to optimize this predictive model for both qualifying sessions and races, equally taking into account all eras of Formula One (1950 - present). From this basic formulation we can assemble higher-level predictions, such as who will get pole position, win a race, or finish on the podium.
This walk-through provides an overview of the model formulation, its parameters, and the approach to tuning those parameters. In general this model attempts to contain the minimum set of parameters and assumptions to generate the highest quality of predictions across the history for Formula One, with a specific set of metrics to ensure high-quality and well-calibrated predictions for drivers and teams at the front of the field.
The system accounts for two types of entities and two components of their performance. The entities are cars (or teams) and drivers. Together a car/driver pair in a single event (race or qualifying session) is referred to as an entrant. For each entity in the data set the system attempts to quantify and predict:- Reliability: the ability of a car or driver to make it to the end of a given race distance.
- A failure of car reliability is a mechanical failure or some other issue which -- through no fault of the driver -- causes the entrant to not make it to the end of the race distance.
- A failure of driver “reliability” is a crash or other driver mistake which causes the entrant to not make it to the end of the race distance.
- Performance: the speed of the car or driver, separate from their reliability.
It is possible for a car or driver to be incredibly quick but unreliable, or relatively reliable but slow.
Reliability
Reliability is, in effect, an attempt to create a survival model for both car and driver over the course of the race distance: “What is the probability a car or driver fails after X kilometers?”
For example, in a 3 kilometer race with 36 drivers, let us say that:
- in the first kilometer, 4 cars and 2 drivers fail;
- in the second kilometer, 3 cars and 2 drivers fail; and
- in the third kilometer, 3 cars and 2 drivers fail.
| Failure Rate | ||
|---|---|---|
| Car | Driver | |
| KM 1 | 4/36 (0.111) | 3/36 (0.083) |
| KM 2 | 3/29 (0.103) | 2/29 (0.069) |
| KM 3 | 3/24 (0.125) | 2/24 (0.083) |
Note that the probability of failure in a given kilometer only considers those entrants still left at the start of that kilometer. There is certainly a possibility of simultaneous failure of both car and driver, but in practice we consider that outcome to be so small as to not be worth quantifying (plus it’s not in the data).
We do not attempt to create a survival model for qualifying sessions for a number of reasons:
- failure data and reasons are generally not available;
- the “distance” of qualifying varies widely both over time and over the field, and is not recorded anywhere;
- some entrants may take only five or six laps to get a qualifying position, while others may take dozens of laps;
- the final effect of qualifying results on the model is less than that of races in general, so the effect of unexpected failures is overall relatively small.
The question then becomes how to create these survival models. With a few exceptions back in the 50s and 60s, race distances are 300 - 305km. The chart below displays failure rates for the first 300km of race distance, meaning that this data captures the vast majority of mechanical and driver related did-not-finishes (DNFs). Failures are bucketed per 3km in order to de-clutter the chart.
The chart shows:
- the percent of cars still in the race which fail during that bucket (the yellow-boxed scatterplot);
- the percent of drivers still in the race which crash during that bucket (the blue-starred scatterplot); and
- the linear regression of those values and the R2 of the fit (lines).
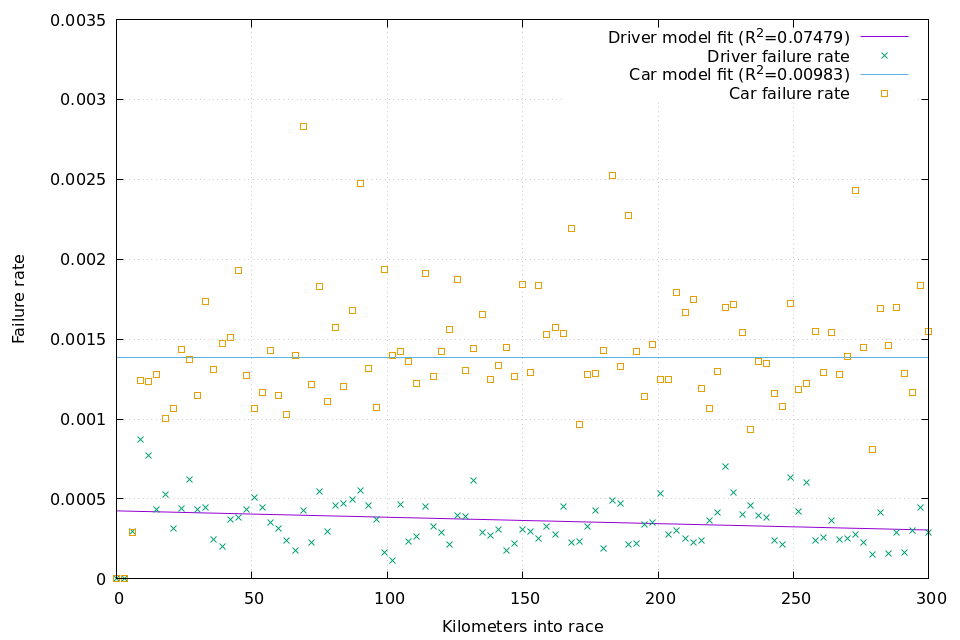
Two things jump out: the rate of failures are higher for cars than drivers, and the rate of failures is relatively constant throughout the race. Given the small R2 for each regression, this indicates that over a long horizon failure is essentially equally random at any given point in time.
Other analysis of car and driver failures also indicates that there is no interaction between driver and car reliability. In other words, the driver cannot drive in a way which either improves or reduces mechanical failure, at least compared to their peers (with, perhaps, one exception).
If these are true, then we can treat each kilometer traveled as essentially an independent roll of the dice to see if the car fails or the driver crashes. The goal of our model, then, is to predict the odds of failure in an average kilometer for each car and for each driver.
Performance
Performance, contingent on finishing the race, is a proxy for speed. There are several challenges.
- “speed” is a direct combination of both driver skill and car (or team) technical performance;
- there tend to be correlations in that the best drivers are more likely to sign with the best teams, and the best teams have better success at hiring the best drivers; and
- the relative contribution of the car to the overall performance has likely gone up over time, as aerodynamics have played a greater role in overall performance.
Unlike reliability, we can predict raw performance for both races and qualifying. In fact, qualifying has some advantages over races in that everyone competes against everyone else more-or-less equally, and everyone finishes, or at least has a finishing position. This allows us to get a full pairwise comparison of all drivers and cars in a single session.
However, we also take into account three differences between qualifying and races:
-
qualifying is shorter in both time and distance, meaning there is less
variance. This means that:
- the same difference in raw speed has more impact on the outcome than in races;
- there is less information to be gained in qualifying than in a race, so we will exchange fewer Elo points between entrants; and
- the structure of qualifying gives no specific structural advantage to one entrant over another, while races have a starting grid which gives an advantage to drivers at the front.
Our model must attempt to quantify each of those factors.
Other Considerations
Like many other models which evaluate data over sequential events, we incorporate common methods, including:
- regressing per-driver and per-team metrics back to the mean slightly between seasons;
- adding small amounts of uncertainty at the start of each season;
- gradually decaying/aging out old data points over time; and
- limiting the “lookback” window (in addition to aging out the data).
Coming up...
Part II will go into the details of the model implementation. Part III will discuss its predictive performance. Part IV will discuss how predictions get aggregated into metrics which span one or more year.